Course engagement report
Course engagement ranks your courses by how much attention they hold. This article covers reading the report and acting on it.
Before you start
You need the Admin or Instructor role. The report needs at least one enrolment on the course to be meaningful.
Step 1 — Open the report
Open Configuration → Analytics and switch to the Course engagement tab. The table lists every course with completion rate, average time-on-task, and drop-off points.
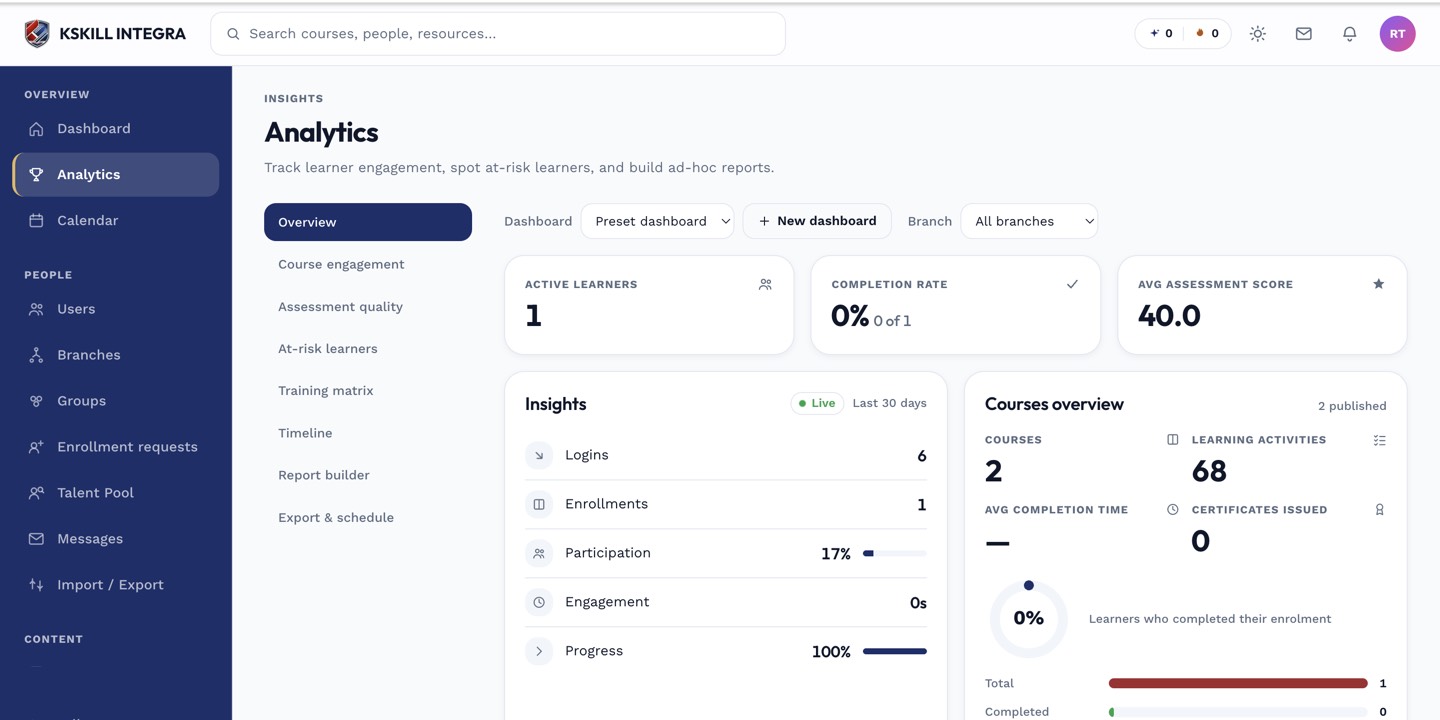
The Overview tab is the one everyone lives in — the deeper tabs answer sharper questions.
Step 2 — Sort by drop-off
Sort by the drop-off column to see courses learners abandon most. Click any row to drill into the per-unit view — the unit at the bottom of a steep drop is usually the one to rewrite. Bad content is easier to see this way than by asking learners.
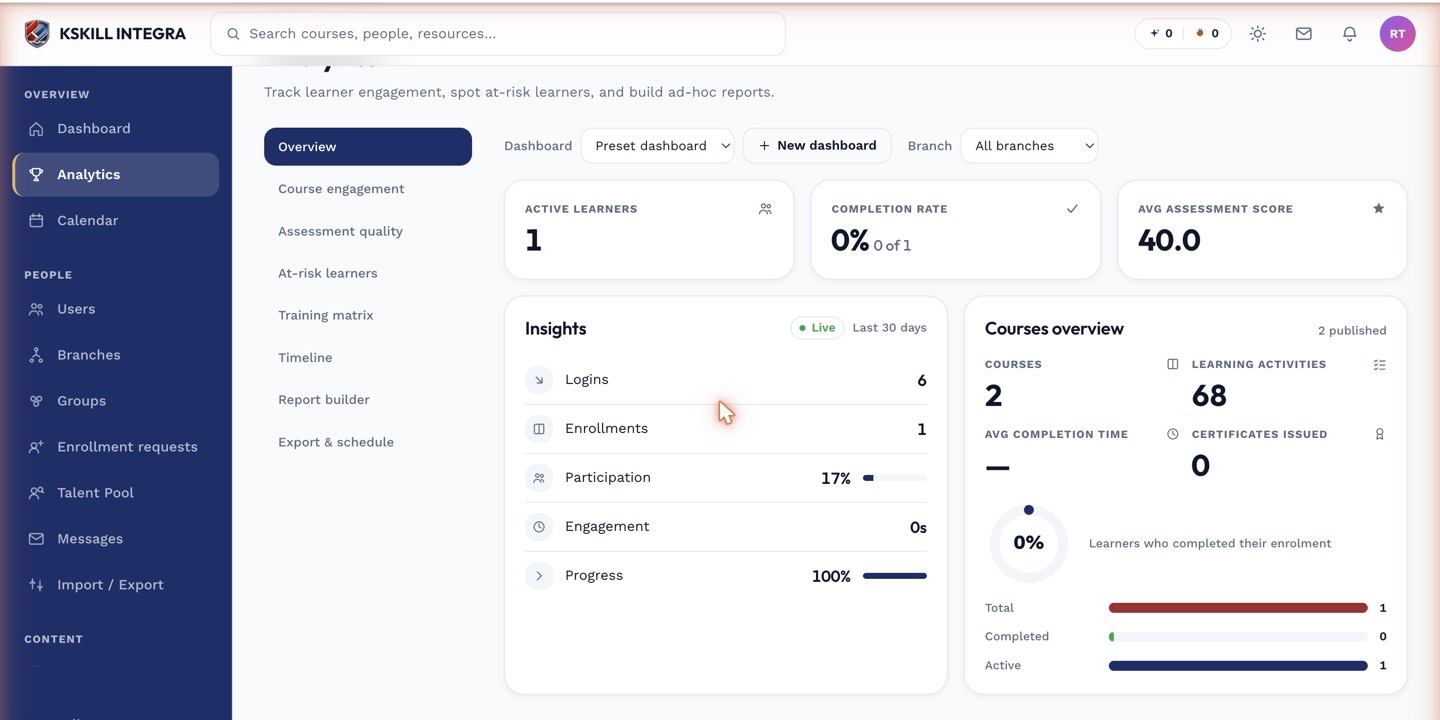
The detail panels give you the breakdown behind each KPI tile.
Step 3 — Act on the signal
For the worst offenders, open the course editor and rework the offending unit. For high-drop-off video units, consider chapter markers or shorter cuts. Re-check the report a week later — a good change should visibly improve completion.
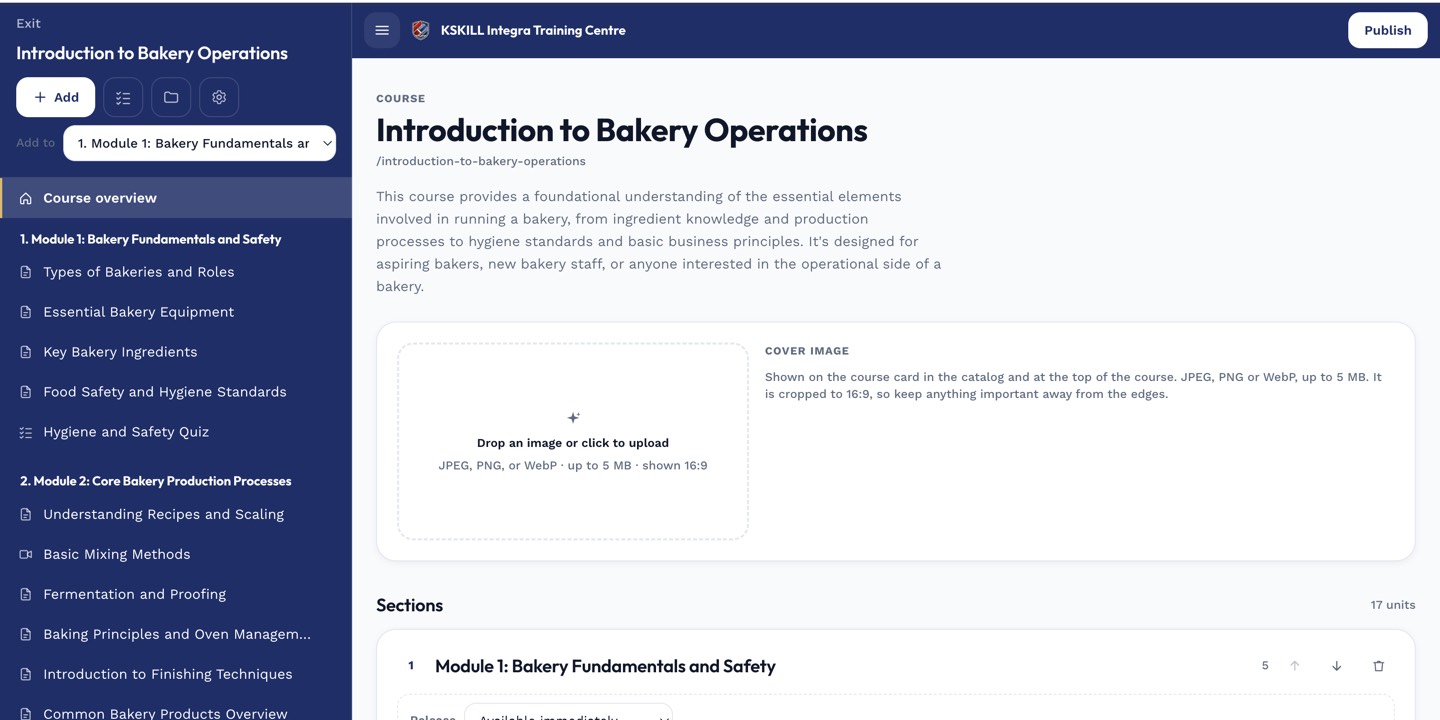
The editor shows sections and units together so you can drag either one to reorder.
Notes
- Small courses with fewer than 20 enrolments are noisy; ignore engagement metrics on them.
- Combine with the At-risk report to spot which learners are hurting engagement.