Build a custom analytics dashboard
The Report builder lets you cut and mail your own dashboard. This article covers picking dimensions, adding filters and saving the layout.
Before you start
You need the Admin role. Reports built here are shareable to any other admin on the tenant.
Step 1 — Open the Report builder
Open Configuration → Analytics and switch to the Report builder tab. The blank canvas prompts you to add panels — each panel is one metric cut by one or two dimensions.
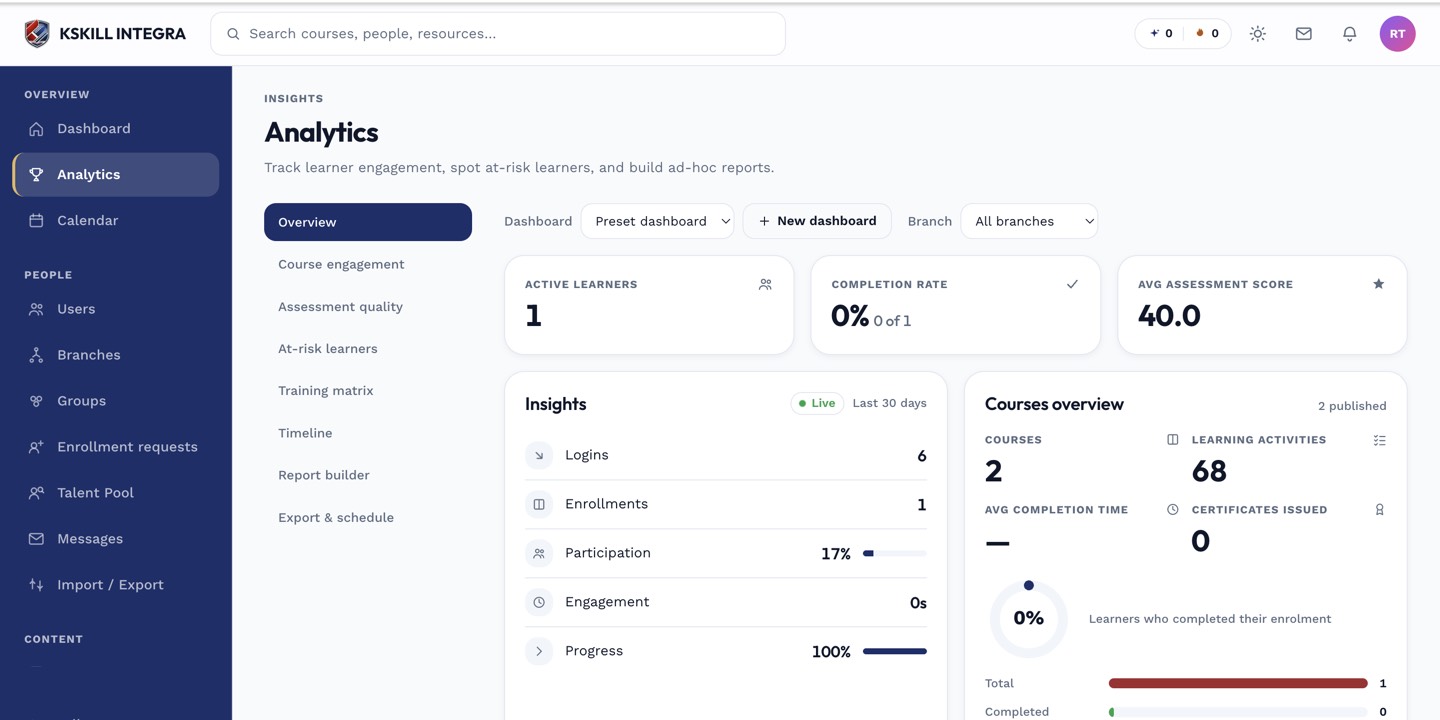
The Overview tab is the one everyone lives in — the deeper tabs answer sharper questions.
Step 2 — Add panels and filters
Click Add panel and pick a metric (completion rate, average score, engaged time). Pick a dimension to group by (course, category, branch, cohort). Add filters (date range, branch, tag). Preview updates live as you tweak.
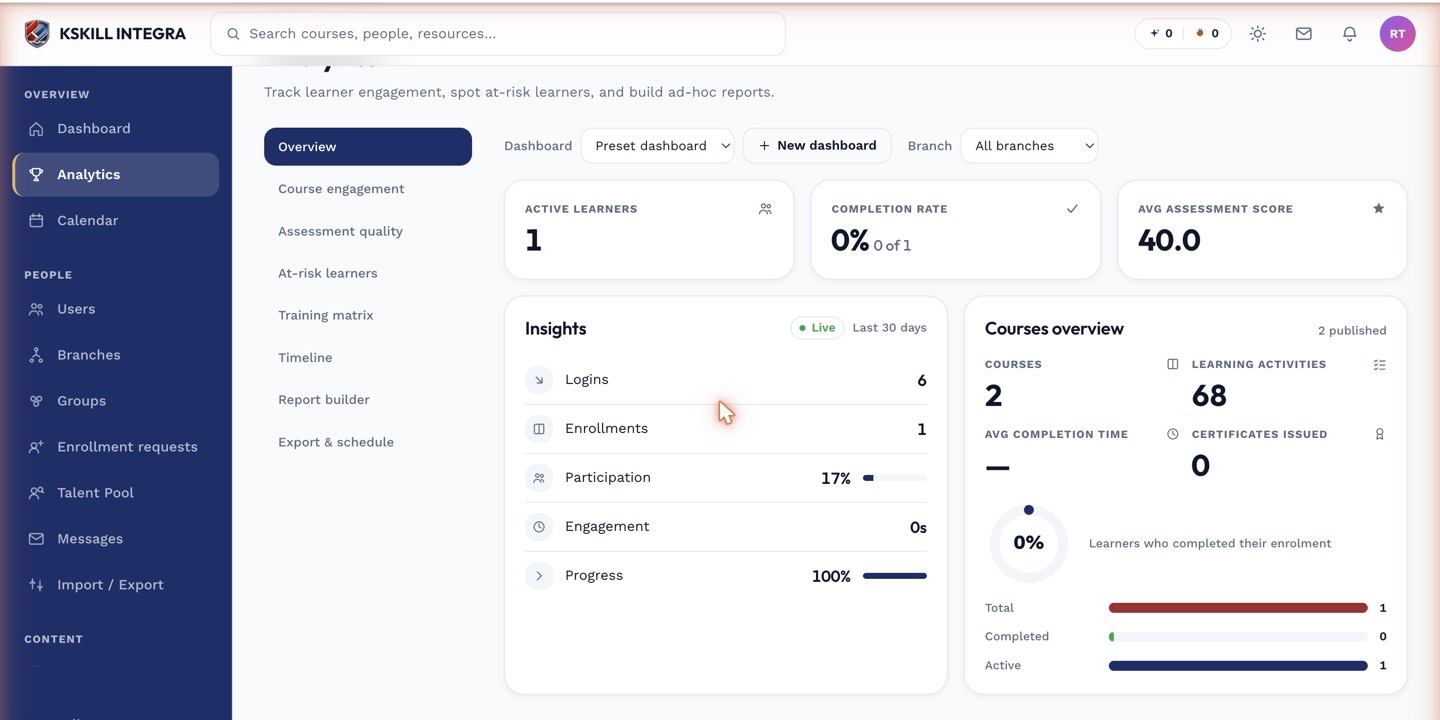
The detail panels give you the breakdown behind each KPI tile.
Step 3 — Save and schedule
Name the dashboard and save. Share it with other admins from the Share icon, or attach it to a scheduled export so it mails weekly. Saved dashboards appear in the sidebar of the Analytics page for quick access.
The detail panels give you the breakdown behind each KPI tile.
Notes
- Dashboards respect branch scoping — instructors seeing a shared dashboard get their branch's slice only.
- For truly custom SQL-shape reports, use the API and your own BI tool.