Course Reports: KPIs and the Course Table
AnalyticsUpdated September 24, 2026
Course reports give you a fast, course-by-course read on how your catalog is performing, starting from a KPI strip and a sortable table you can drill into.
Where it lives
Open Analytics → Course reports. You need the Admin or Instructor role with reporting access.
The KPI strip
Across the top you'll see summary numbers — total enrollments, completion rate, and similar catalog-wide metrics — giving you a quick read before you drill into any single course.
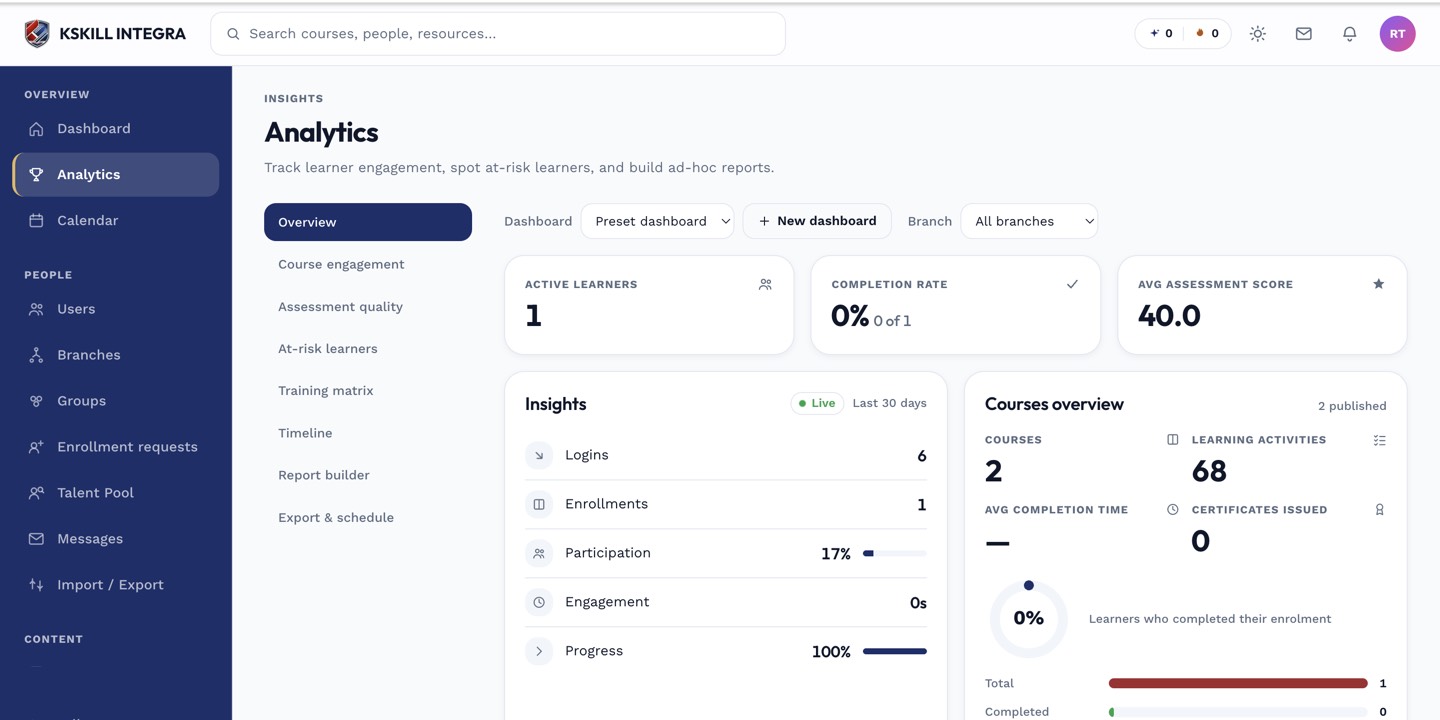 The KPI strip updates as you filter the underlying course table.
The course table
Below the KPIs, each course appears as a row with its own enrollment count, completion rate, and average progress. Clicking a course opens its learner roster.
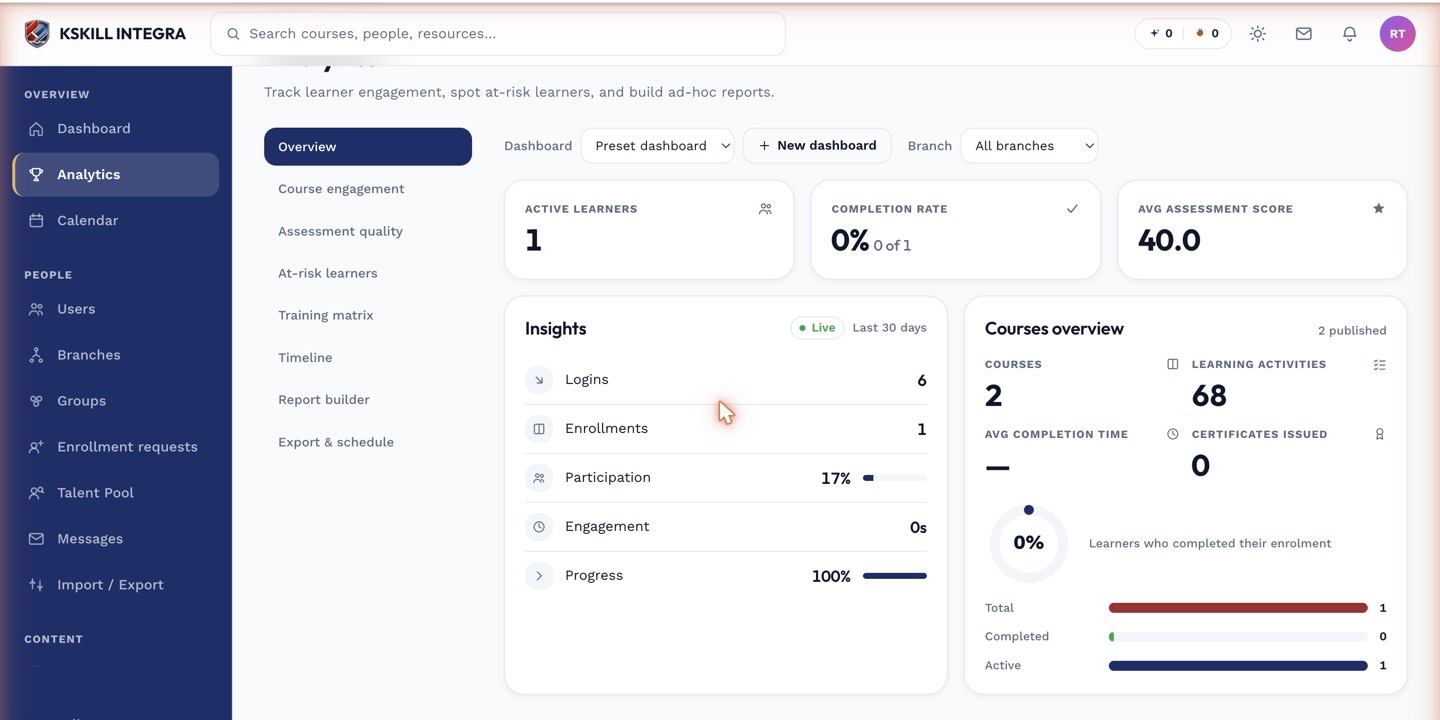 Selecting a course row is the entry point into per-learner detail.
Notes
Course reports focus on a single course's own learners. For a cross-course view of who might be falling behind, see at-risk learners instead.
What next?
#analytics#course-reports#kpi#reporting