Reports overview
Reports let you answer questions across many learners at once. This tour points at the six report types most admins use weekly.
Before you start
You need the Admin or Instructor role. Instructors see reports scoped to their branches only.
Step 1 — Open Analytics
Open Configuration → Analytics. The Overview tab is the KPI roll-up; the other tabs are the report library. Every report starts here and pipes into the same export pipeline.
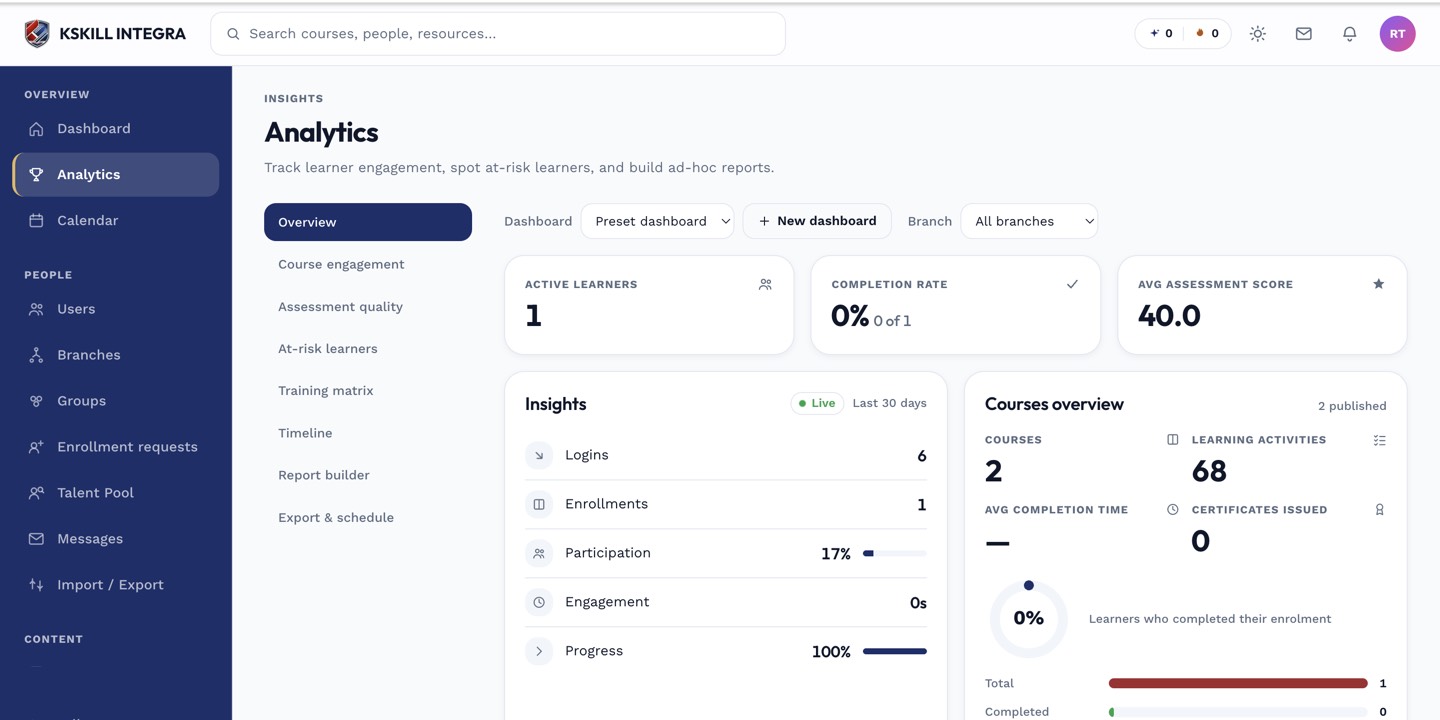
The Overview tab is the one everyone lives in — the deeper tabs answer sharper questions.
Step 2 — Pick the report for the question
Course engagement ranks courses by attention. Assessment quality flags outlier questions. At-risk lists learners trending to fail. Training matrix maps role skills against completions. Timeline replays events. Compliance rolls up certificates by deadline.
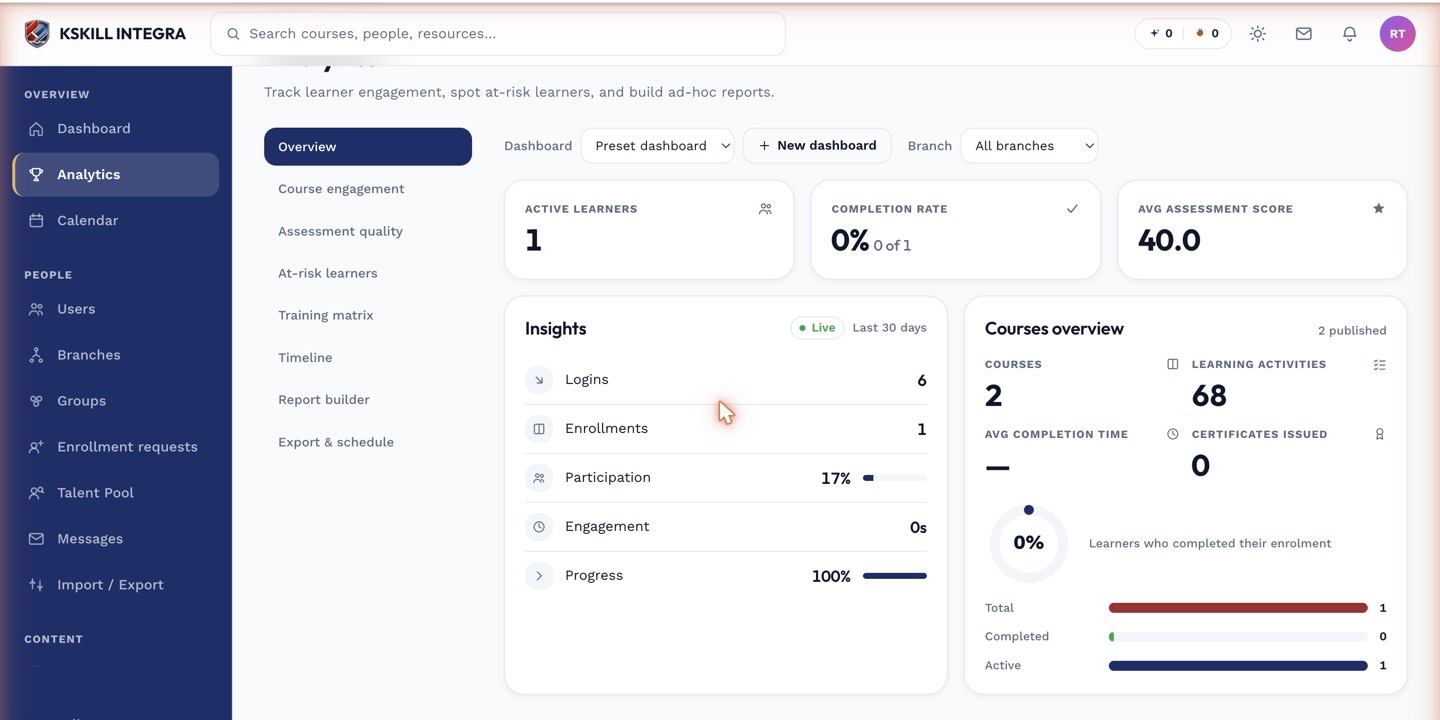
The detail panels give you the breakdown behind each KPI tile.
Step 3 — Cut, export or schedule
Every report supports filters (date range, branch, tag), CSV/PDF export, and a scheduled email option. Cut it live for a meeting, export for a spreadsheet, or schedule for a Monday-morning digest to stakeholders.
The Overview tab is the one everyone lives in — the deeper tabs answer sharper questions.
Notes
- For truly custom shapes, use the Report builder or the Reports API.
- Branch scoping is enforced — instructors see only their branches.